
Coffee Shop Data Analysis
Context: One week data analysis project
Project Type: Academic
Time: 2020 February
Role: Data Analysis, Data Visualize, Research
Tools: Adobe Illustrator, Microsoft Excel, MySQL, Tableau
Introduction
The sample dataset is from a fictional coffee shop chain with three locations in New York City. The goal is to analyze the data and provide suggestions to help business owners increase their profits.
Process
I began by cleaning the data with Microsoft Excel and MySQL; the dataset tells me the best selling products: products that make the most profit and the store with the highest revenue. With this, I tried to find out what is the reason that caused these results then visualized my research by using Tableau to propose my findings to the class.
Findings and Recommendations
The number shows that the new customer conversion rate has decreased.
The conversion rate for Generation Z has increased since 2019, but the conversion rate for Baby Boomers, Generation X, and Older Millennials have decreased compared to 2017 and 2018.
I would suggest the coffee shop chain to work on the marketing strategy toward the younger generation to help bringing up the conversion rate.
Coffee bean sales are 280% higher than expect.
Customers tend to buy beverages and foods at the beginning and end of the month. The demand for beverages decreases when customers buy their coffee beans.
I would suggest the coffee shop chain to have some promotions on food and beverage, such as selling them as a combo to bring up the sales during the month.
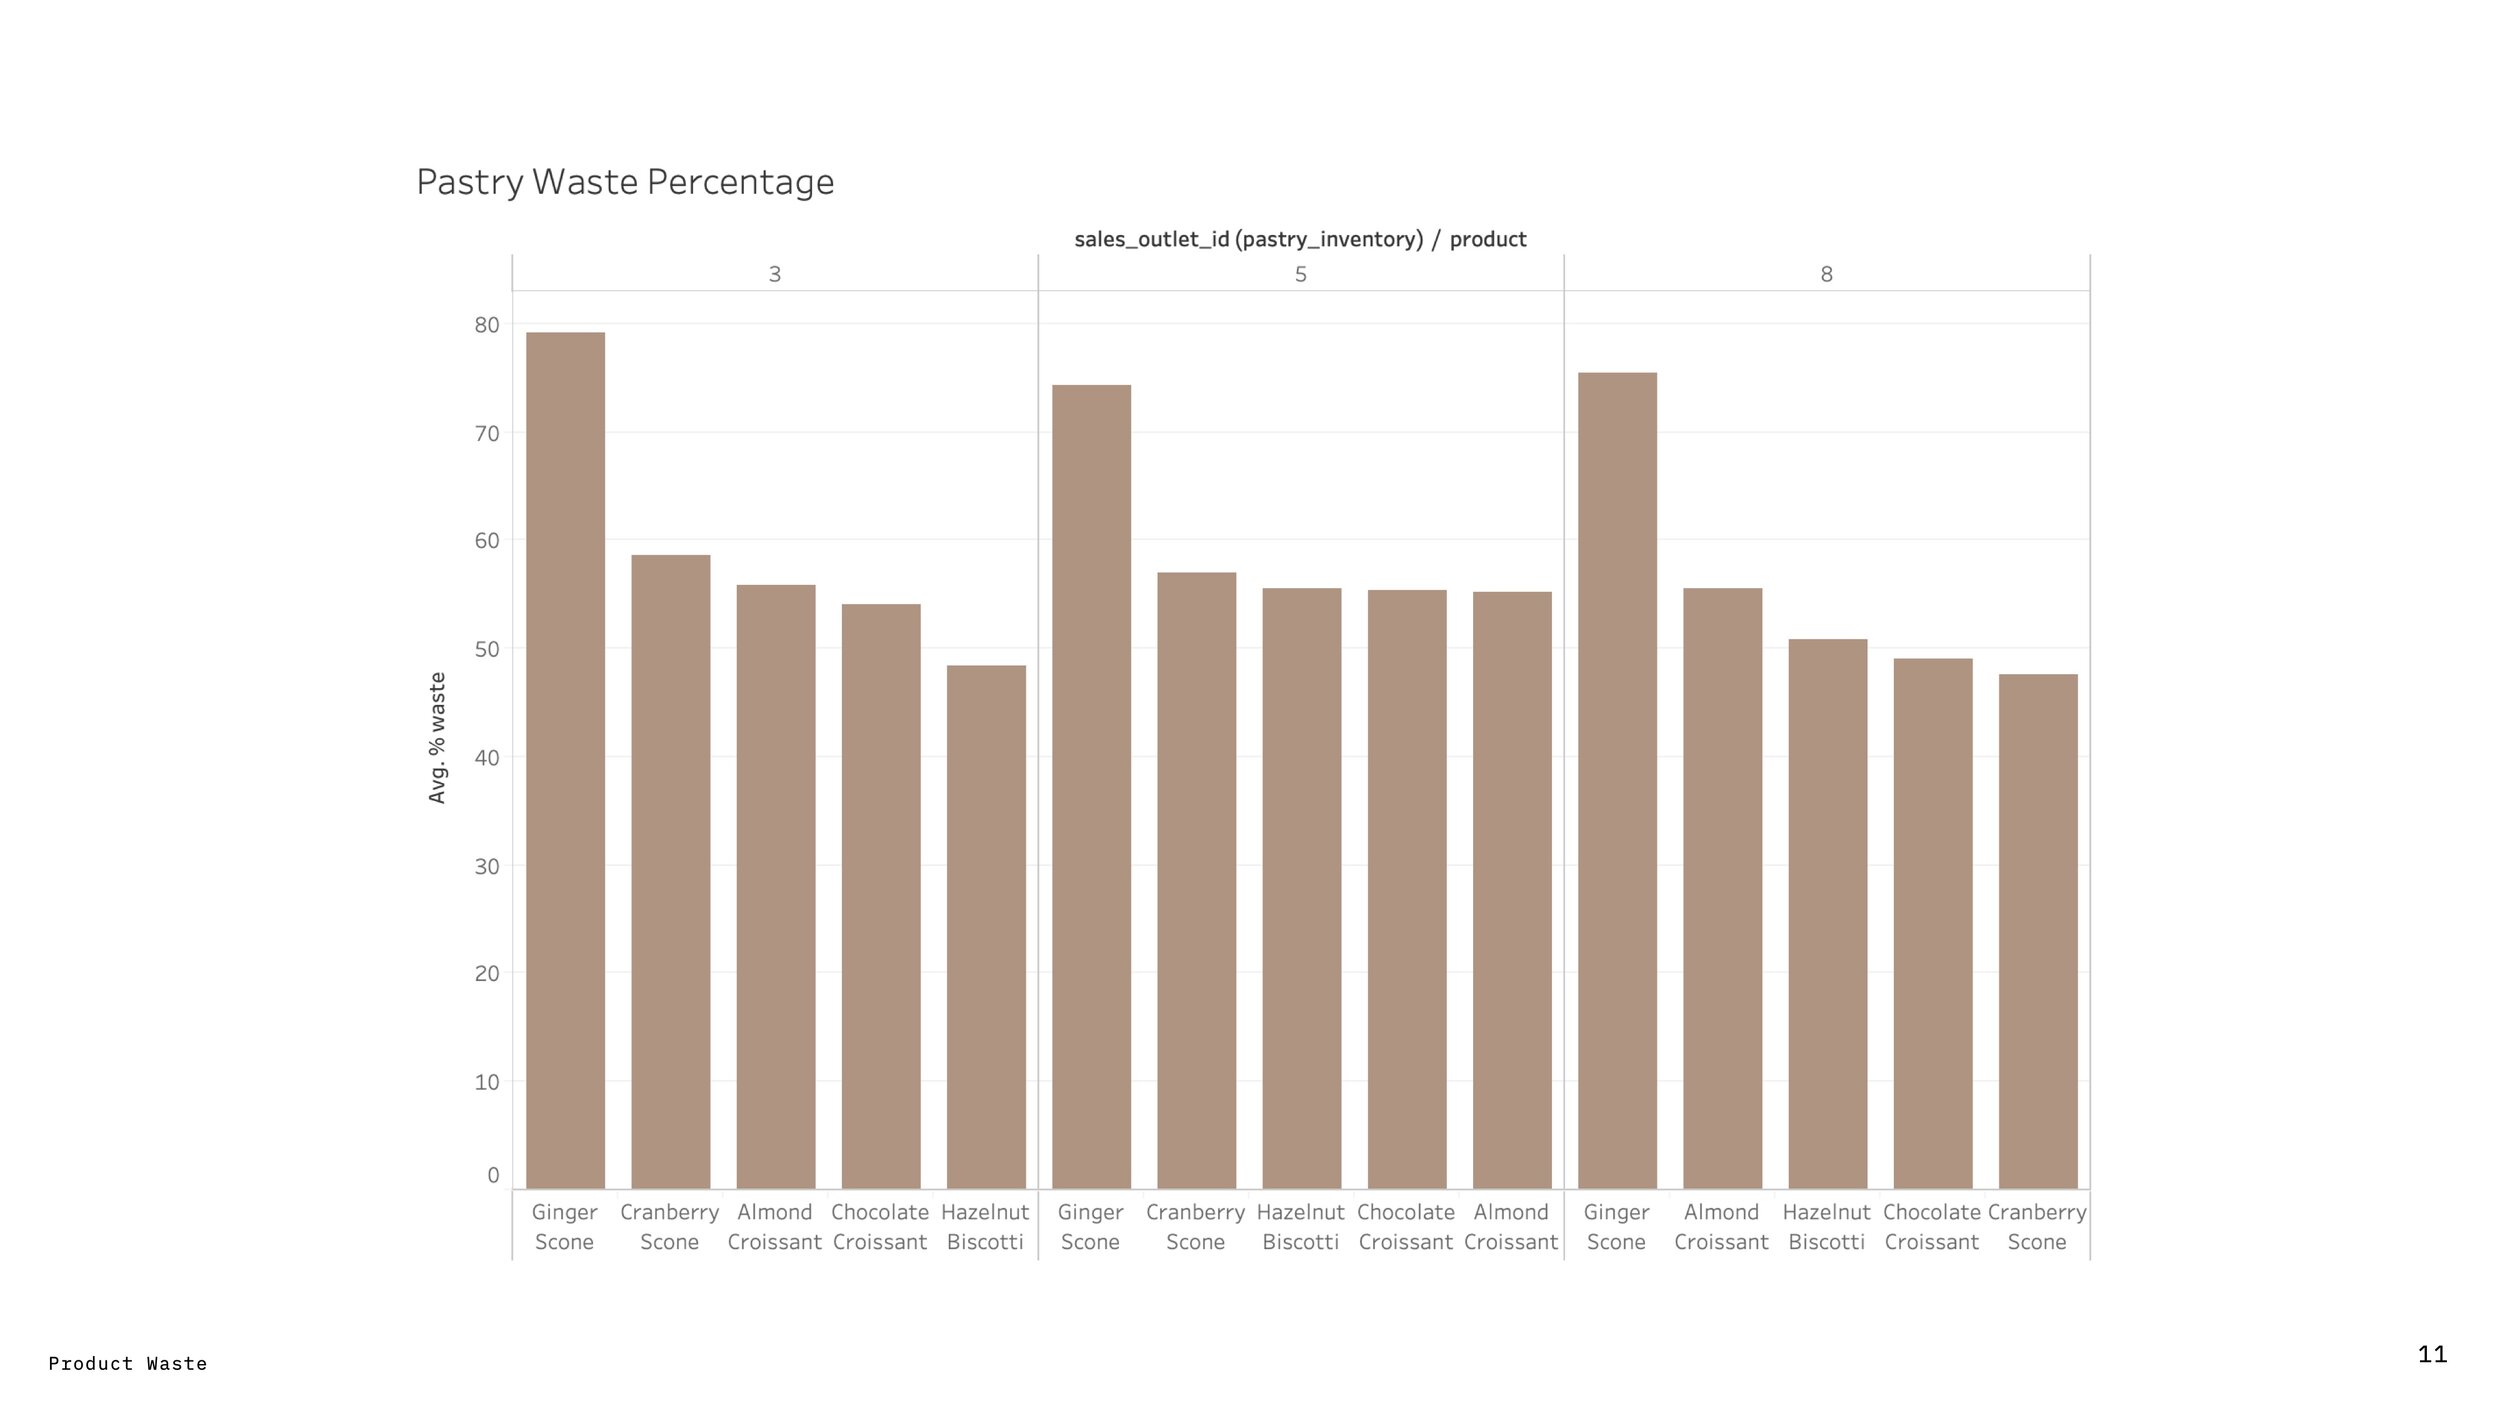
More than 55% of pastries have become waste in each location.
The coffee shop chain earns $3464.43 from the pastries sale in April 2019 but loses $9983.52 on the pastries' waste, which makes their pastry sale harmful profit.
I would suggest the coffee shop chain reduces at minimum 40% orders of the pastries so the stores can end up with a positive profit of $2058.08.
Presentation Slides


Reflection
Working in the retail industry for several years, I know numbers represent the store's performance. Other than numbers, I think it is also important for companies to understand the reason that caused the number raised or dropped then make an adjusment to improve the business.